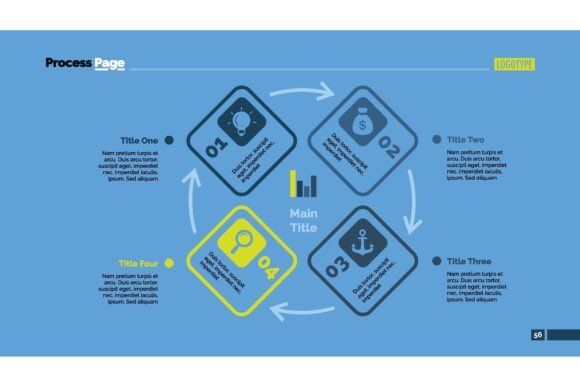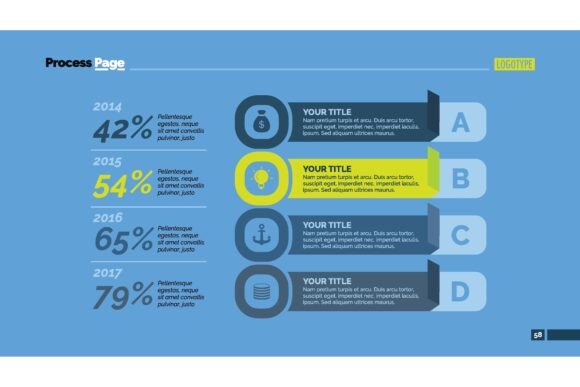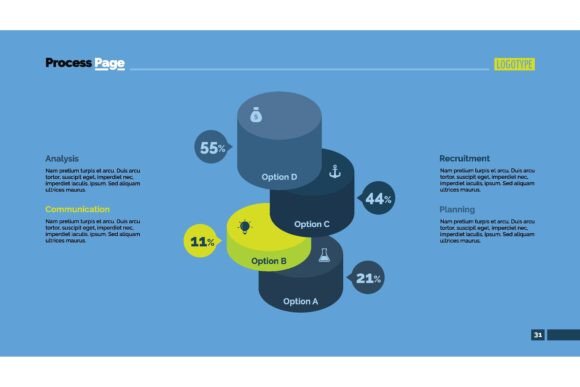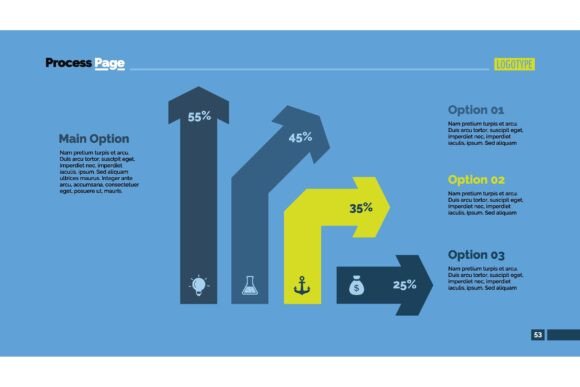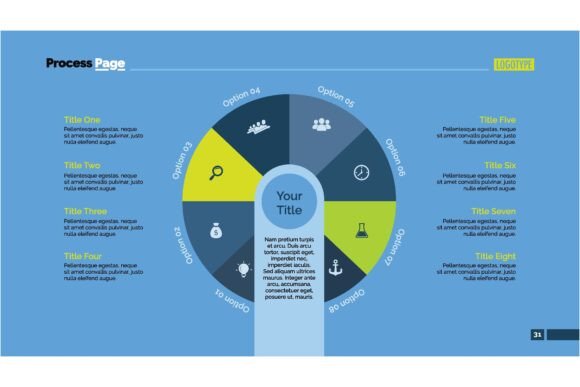
Four Options Percentage Chart Slide Template
You have seen presentation slides crammed with bullet points and cluttered bar charts. They blur together, and your audience checks their phones. The Four Options Percentage Chart Slide Template offers a different path—a flower-like diagram that turns dry percentages into something people actually remember. This template is not just about looking pretty. It is a structural tool that helps you communicate proportional data, planning breakdowns, or research findings in a way that feels intuitive. When used well, it transforms a forgettable slide into the one everyone recalls. When used poorly, it becomes just another confusing graphic. Let's walk through the common pitfalls and, more importantly, how to sidestep them.
What This Template Actually Does
At its core, the Four Options Percentage Chart Slide Template arranges four data points around a central hub, like petals on a flower. Each segment represents a percentage, and the visual layout makes comparisons immediate. Executives, educators, and marketers use it for budget allocation, survey results, market share breakdowns, or even project priority charts. The genius is that it forces you to simplify. You cannot stuff forty data points into four petals—you must choose what matters most. That constraint is actually a gift. It makes you distill your message until only the essential percentages remain.
Mistake One: Forcing the Wrong Data into the Petals
The most common error I see is people trying to use this template for data that does not naturally fit four discrete categories. If your dataset has six meaningful segments or your information is sequential rather than proportional, the flower diagram works against you. I watched a product manager cram seven revenue streams into four petals by merging three unrelated categories. The result was a chart that confused stakeholders and led to a budget misallocation that cost the company real money.
What to do instead: Before you open the template, ask yourself: do I have exactly four items that add up to 100%? If the answer is no, this is not the right tool. Consider a different chart type or, if you absolutely love the visual, collapse your data into four clean buckets that genuinely represent distinct categories. Do not mash unrelated items together just to fit the format.
Mistake Two: Neglecting the Percentage Balance
Another subtle trap involves ignoring whether your percentages actually sum correctly. It sounds basic, but I have seen slides where the four petals added up to 87% or 112%. Audiences notice. Even if they do not mentally sum the numbers, the visual proportions feel wrong. That unease erodes trust in your entire presentation.
Check your math before you design. Use a spreadsheet to verify that your four figures total 100%. If you are showing rounded percentages, include a note that totals may not equal 100 due to rounding. Better yet, keep one decimal place so the sum is exact. Your credibility is worth the extra thirty seconds.
Mistake Three: Choosing Colors That Obscure the Message
The flower layout offers a natural opportunity for color coding, but many presenters treat color as decoration rather than information. I once reviewed a slide where all four petals were shades of blue so similar that the audience could not distinguish them from the back of the room. The presenter kept saying "as you can see in the blue section," while people squinted. That is a communication failure, not a design choice.
Use color to differentiate, not to decorate. Assign each petal a distinct hue from a cohesive palette. Make sure the contrast works for colorblind viewers by also using patterns or labels inside each segment. Tools like ColorBrewer can help you choose accessible palettes. If you present on a projector, test the slide in the actual room beforehand. A color that looks bright on your monitor may wash out under conference room lights.
Mistake Four: Overloading Petals with Text
I understand the urge to explain everything on the slide. You want your audience to understand each percentage immediately, so you add bullet points inside each petal. The result is a crowded, unreadable mess. The flower diagram thrives on simplicity. Each petal should contain only the percentage, a short label, and maybe one supporting word.
The right approach: Put the details in your speaker notes or in a companion handout. On the slide, let the visual do the heavy lifting. For example, if one petal shows "32% – Marketing," that is enough. Your verbal explanation provides the context. If you absolutely need supporting text, place it outside the petal with a thin connecting line. Keep the flower itself clean and readable from the back of the room.
Mistake Five: Ignoring the Central Hub
The center of the flower diagram is not dead space. It is an opportunity. Many users leave it blank or fill it with a generic icon that adds no value. That is a wasted chance to anchor the entire chart. The hub can hold the total figure, the category name, or a short question that the percentages answer.
Make the hub work for you. If your chart shows budget allocation, the center might say "Q4 Budget – $500K" so everyone immediately knows what the petals represent. If the chart shows survey responses, the hub could read "Customer Satisfaction Drivers." A well-used hub gives context without cluttering the petals. Keep it to a few words or a single number.
Mistake Six: Forgetting the Audience's Perspective
Here is something overlooked: the flower diagram is visually engaging, but it is not always the most intuitive format for every audience. A group of data analysts may prefer a straightforward bar chart where they can compare exact values quickly. A creative team, on the other hand, might appreciate the flower's organic feel. I have seen presenters default to the flower template for every quarterly report simply because they liked how it looked, without considering whether the board members preferred tables.
Know your room. If you are presenting to executives who value speed over aesthetics, pair the flower diagram with a simple table on the same slide or in the handout. Let the flower capture attention, then let the table confirm the numbers. That hybrid approach satisfies both the visual learners and the detail-oriented number crunchers in the audience.
What to Check Before You Finalize the Slide
Before you export your presentation, run through this quick checklist. First, confirm that each petal's percentage is accurate and that the total equals 100. Second, verify that the labels are legible at the font size you are using—small text inside a curved shape is notoriously hard to read. Third, test the color contrast on a projector or a second screen. Fourth, check that the hub text does not overlap with the petal boundaries. Fifth, ask a colleague who has not seen the slide to interpret it without your explanation. If they cannot quickly state what the chart shows, simplify further.
Better Approaches for Specific Scenarios
Consider a marketing manager presenting channel performance. Instead of four generic petals labeled "Social," "Email," "Search," and "Other," she uses the flower to show percentage of leads generated by each channel, with the hub reading "Lead Sources Q3." She colors each petal to match the brand's channel icons. The slide is clear, memorable, and sparks a discussion about reallocating budget.
An educator explaining survey results might use the template to show student preferences for learning formats—in-person, hybrid, asynchronous, and project-based. The flower shape immediately communicates that these are parts of a whole, not separate categories. The educator adds a simple legend outside the diagram for clarity, avoiding text inside the petals entirely.
An entrepreneur pitching to investors can use the flower to show how they will allocate seed funding across product development, marketing, operations, and reserves. The hub displays the total funding amount. The percentages are round numbers for quick mental processing. The visual reinforces the story of a balanced, thoughtful strategy.
Why Simplicity Wins Every Time
The Four Options Percentage Chart Slide Template works best when you resist the temptation to add more. More colors, more text, more categories, more effects. Every extra element dilutes the core message. Your audience should grasp the proportions in under three seconds. If they are still decoding the slide after ten seconds, you have lost them. Treat the template as a constraint that sharpens your thinking. Force yourself to choose the four most important percentages and nothing else. That discipline will make your presentations clearer, your arguments stronger, and your audience more engaged.
When you get it right, the flower diagram does not just display data—it tells a story. The largest petal draws the eye first, and you can verbally walk your audience through the remaining three in order of impact. That natural visual flow is something a bar chart or pie chart rarely achieves. The flower is memorable because it is unexpected. Use that unexpectedness strategically, and your audience will remember not just the chart but the insight behind it.
The bottom line: This template is a tool, not a crutch. Use it when your data fits four proportional categories. Verify your numbers. Keep the design clean. Know your audience. And never let the flower become more important than the message it carries. Done right, it elevates your report and makes complex breakdowns feel almost effortless. That is the kind of communication that builds trust, drives decisions, and makes people want to see your next presentation.